
Measure of Cluster Proximity
The Measure of Cluster Proximity (MCP) is a quantitative metric to evaluate consonant cluster production in speech development. This measure addresses the issue of quantitatively differentiating stages in cluster production highlighted by the common patterns of cluster reduction, vowel epenthesis, two-member productions, with either substituted or correct phones.
References
Babatsouli, Elena & Dimitrios Sotiropoulos. 2018. A Measure for Cluster Proximity (mcp) in Child Speech. Clinical Linguistics & Phonetics 32(12). 1071–1089. https://doi.org/10.1080/02699206.2018.1510982.
Babatsouli, Elena (2021) Correlation between the Measure for Cluster Proximity (MCP) and the Percentage of Consonants Correct (PCC). Clinical Linguistics and Phonetics, 35(1), 65-83. doi: 10.1080/02699206.2020. 174418.
Data Preparation
Session data is queried by word for each IPA Target and IPA Actual tuple. Proper syllabification and phone alignment is required for accurate results. All participants should have unique names/identification numbers and a speaker should be assigned to all records.
MCP Data
- ContextContext will include the type of target cluster as well as the word location. Four types of clusters are considered in the analysis:
- Word-initial Onsets (OOi)
- Word-medial Onsets (OOm)
- Word-medial Coda+Onset (COm)
- Word-final Codas (CCf)
- Pattern
Pattern is a two or three letter code describing the IPA Target and IPA Actual alignment.
Srepresents substitution,Drepresents deletion,Crepresents correct, andVrepresents vowel epenthesis. - Proximity
Each Pattern is assigned a proximity value between 0% and 100%, with all values set in 12.5% increments between 0% and 100%, each of which provides a combined assessment of both the number of phones produced and the quality of these phones relative to the target cluster (Babatsouli & Sotiropoulos 2018; Babatsouli 2020), as shown in the proximity lookup table below.
Table 1. Proximity Lookup Table Pattern Proximity (%) DD0 CC100 DS12.5 SD12.5 SVD18.75 DVS18.75 CD25 DC25 CVD31.25 DVC31.25 SVS37.5 CVS50 SVC50 CVC62.5 SS75 CS87.5 SC87.5
Parameters
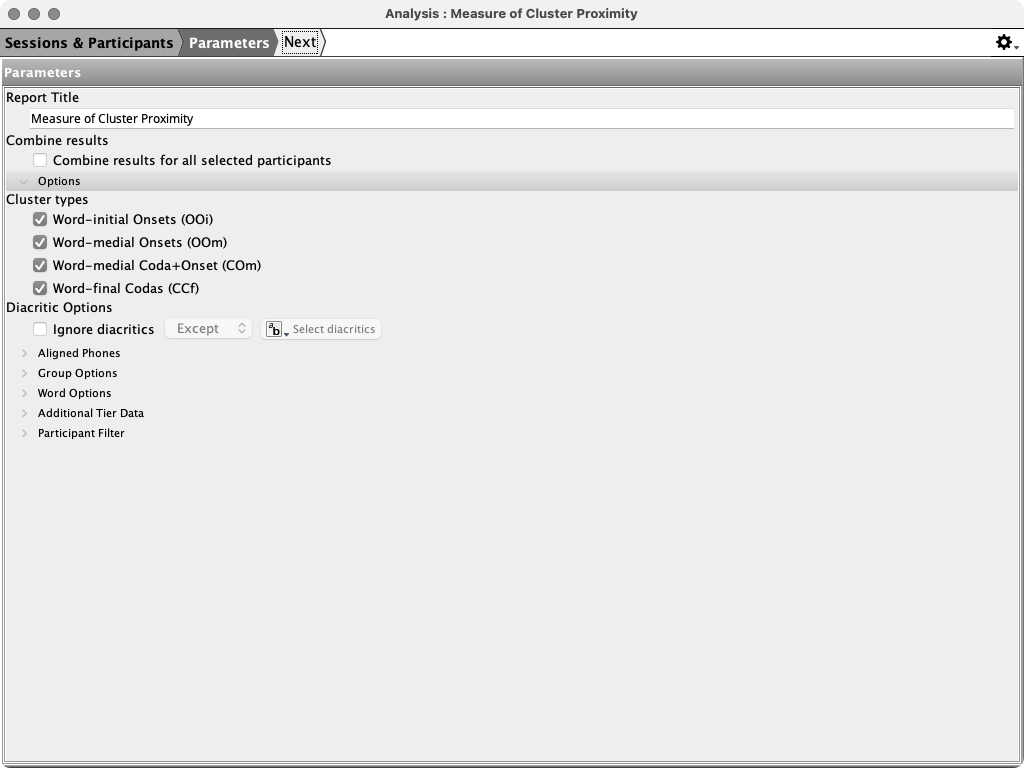
- Word-initial Onsets (OOi)
- Word-medial Onsets (OOm)
- Word-medial Coda+Onset (COm)
- Word-final Codas (CCf)
Other parameters
- Ignore diacritics - ignore diacritics when comparing phones (default: no)
- Group Options
- Word Options
- Additional Tier Data
- Participant Filter
Report Outline
A sample table of contents is displayed below. Bold level elements are section headers while italic items are tables.
Measure of Cluster Proximity
-
Summary
- Participant 1
- Summary
- Aggregate (all clusters)
- Aggregate (OOi)
- Aggregate (OOm)
- Aggregate (COm)
- Aggregate (CCf)
- … (for each selected participant)
-
Listing
-
Example
Click the link below to view an example report.
 Example Report