
Percent Phones Correct (PPC)
The PPC analysis will calculate the percent phones/consonants/vowels correct in the sampled data.
Data Preparation
Session data is queried by word for each IPA Target and IPA Actual tuple. Proper syllabification and phone alignment is required for accurate results. All participants should have unique names/identification numbers and a speaker should be assigned to all records.
Parameters
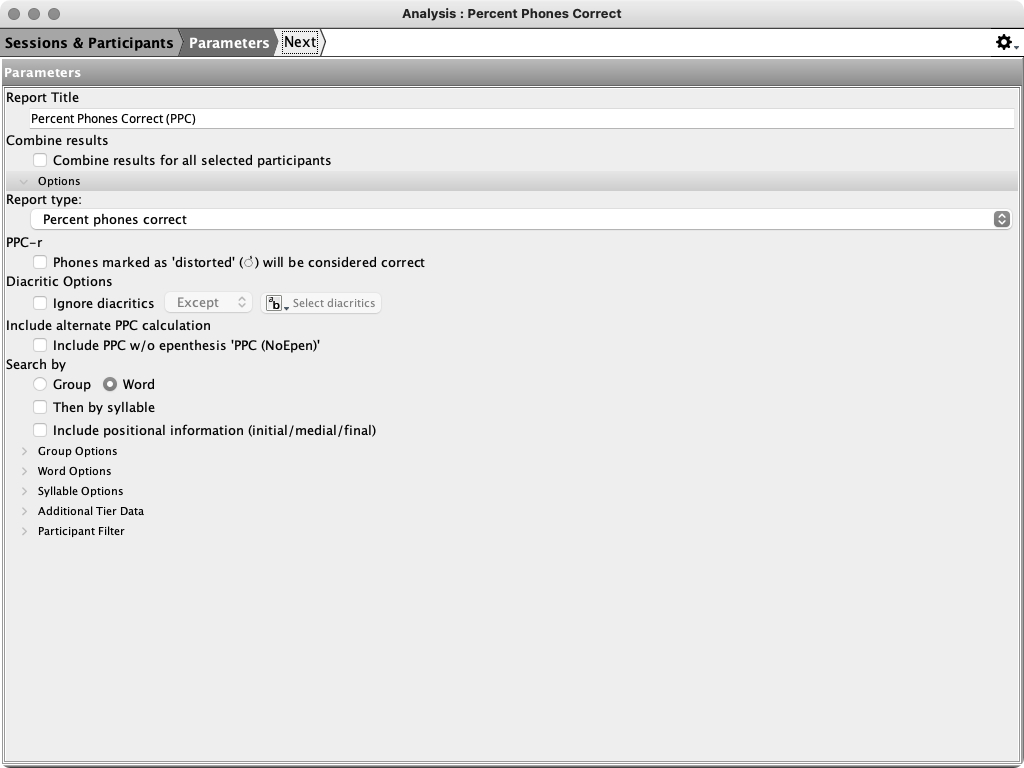
- Percent phones correct - all phones.
- Percent consonants correct - all consonants (i.e., PCC)
- Percent vowels correct
- Percent singleton consonants correct - singleton consonants.
- Percent cluster consonants correct - cluster consonants. There are three
report sub-types available when this option is selected:
- All clusters
- Tautosyllabic clusters
- Heterosyllabic clusters
- Percent onset consonants correct. There are three report sub-types available
when this option is selected:
- All onsets
- Singleton onsets
- Cluster onsets
- Percent coda consonants correct. There are three report sub-types available
when this option is selected:
- All codas
- Singleton codas
- Cluster codas
- Percent nucleus phones correct. There are three report sub-types available
when this option is selected:
- All nuclei
- Monophthongs
- Complex vocoids
- Percent correct (custom)
When 'Percent correct (custom)' is selected a custom Phonex expression may be entered to create a custom phone set. See Example Phones Queries for some useful examples.
Other parameters
- PPC-r - phones marked with the distorted diacritic will be considered correct (default: no)
- Ignore diacritics - ignore diacritics when comparing phones (default: no)
- Include PPC w/o epenthesis 'PPC (NoEpen)' (see below)
- Search by
- Group Options
- Word Options
- Syllable Options
- Additional Tier Data
- Participant Filter
PPC Calculation
PPC is calculated using the following equation:
If requested a second PPC column which does not include epenthesis may be added to the report. The column will be named 'PPC (NoEpen)'.
Report Outline
A sample table of contents is displayed below. Bold level elements are section headers while italic items are tables.
Percent Phones Correct (PPC)
-
Summary
-
All Participants
-
IPA Patterns
-
- Participant 1
- Summary
- IPA Patterns
- … (for each selected participant)
-
Listing (All Results)
-
Example
Click the link below to view an example report.
 Example Report
References
- Shriberg, L. D., & Kwiatkowski, J. (1982). Phonological disorders III : A procedure for assessing severity of involvement. Journal of Speech and Hearing Disorders, 47, 256–270.
- Shriberg, L. D., Austin, D., Lewis, B. A., McSweeny, J. L., & Wilson, D. L. (1997). The Percentage of Consonants Correct (PCC) Metric: Extensions and Reliability Data. Journal of Speech, Language, and Hearing Research, 40(4), 708–722.Today